Japan Aerospace Exploration Agency Earth Observation Research Center ALL RIGHTS RESERVED.

|
2003/1/20
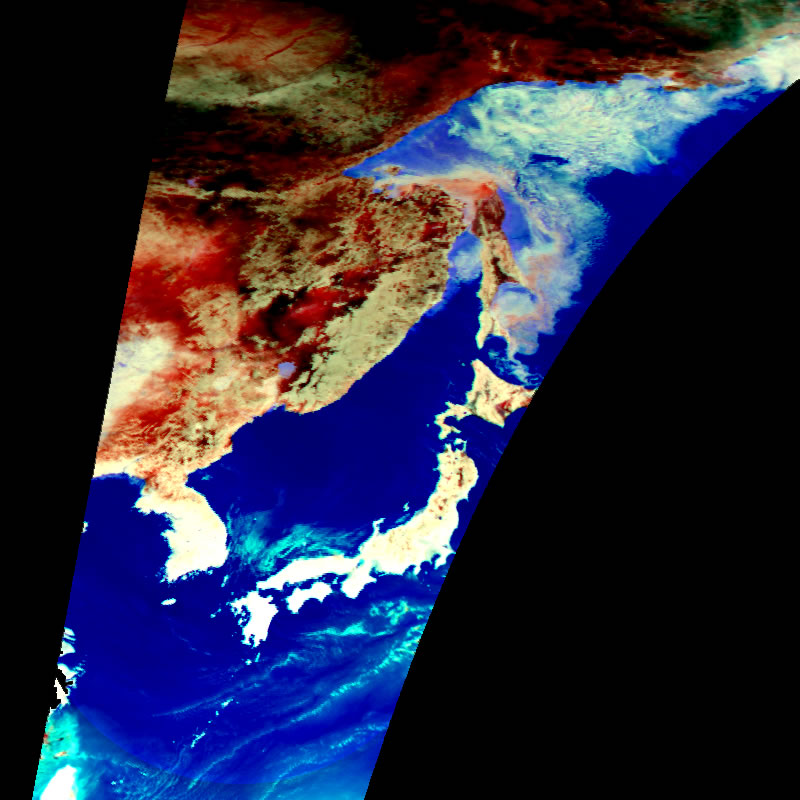
AMSR First-light images: AMSR capturing the Japanese Islands / Sea ice distribution in the Sea of OkhotskAMSR capturing the Japanese IslandsThe false-color composite image is from the data obtained by the Advanced Microwave Scanning Radiometer (AMSR) onboard the Midori-II (Advanced Earth Observing Satellite-II: ADEOS-II). Both AMSR and Midori-II were developed by the National Space Development Agency of Japan (JAXA). Brightness temperatures of 36.5-GHz (horizontal polarization) and 89.0-GHz (both vertical and horizontal polarization) channels were used. The data is acquired around 11 a.m. on January 18, 2003 JST. Over the Pacific Ocean and Japan Sea, the areas of light blue correspond to high-concentration liquid water clouds. In the Sea of Okhotsk, colors varying from light blue to white correspond to sea ice distribution.
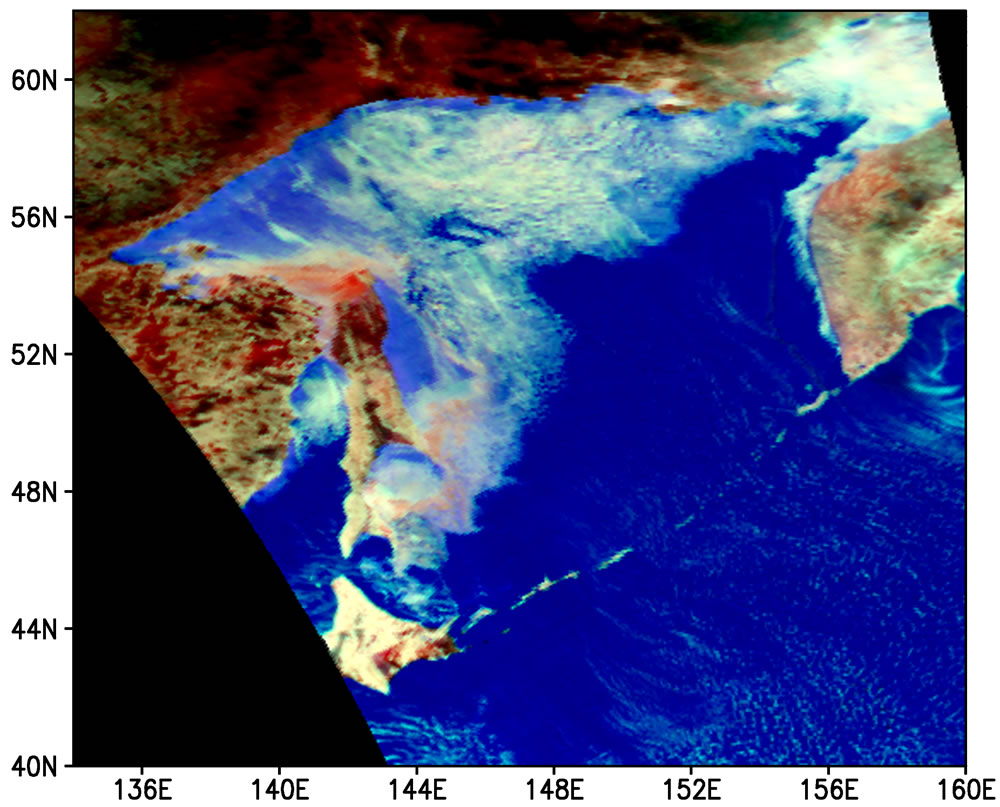
Sea ice distribution in the Sea of Okhotsk observed by AMSRSea ice distribution in the Sea of Okhotsk captured by the Advanced Microwave Scanning Radiometer (AMSR) aboard the Midori-II (Advanced Earth Observing Satellite-II: ADEOS-II). Both AMSR and Midori-II were developed by the National Space Development Agency of Japan (JAXA). The left image is a false-color composite using the data acquired at night time (around 20:30) on January 18, 2003 JST. Brightness temperatures of 36.5-GHz (horizontal polarization) and 89.0-GHz (both vertical and horizontal polarization) channels were used. In the Sea of Okhotsk, colors varying from light blue to white correspond to sea ice. Distribution of newly-formed sea ice is approximately indicated by light blue. Areas of light blue over the Pacific Ocean correspond to high-concentration liquid water clouds. It is the advantages of microwave observation techniques to enable measurements during night and day. Thus, through non-precipitating clouds, the sea ice extension can be well distinguished using the night-time image.
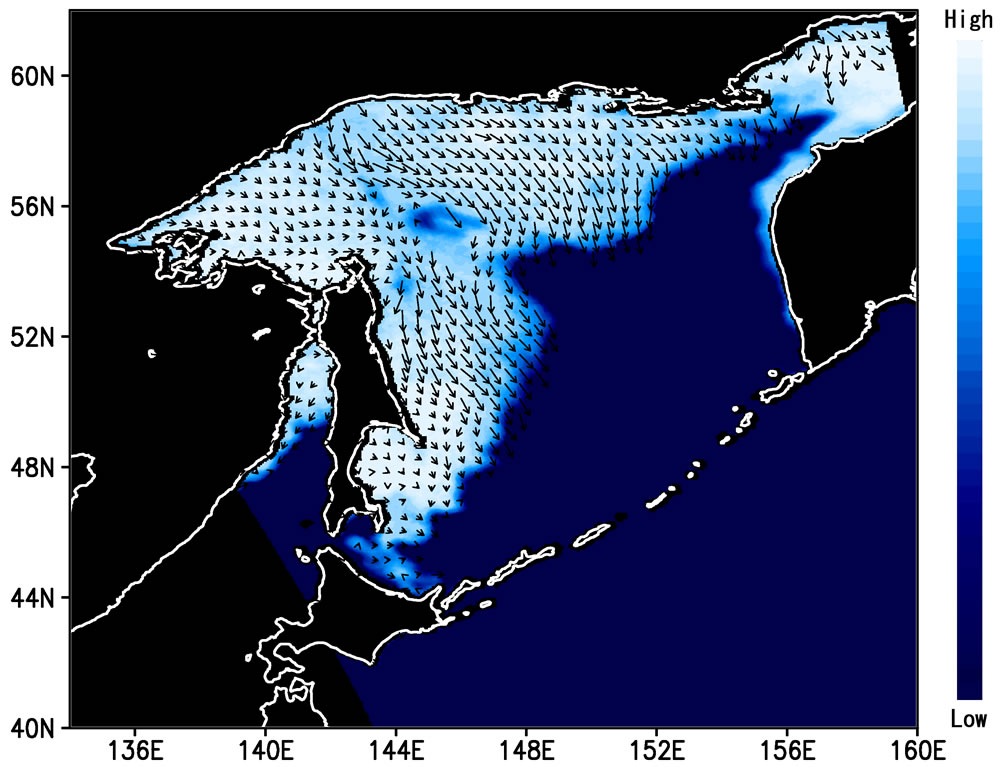
The right image shows the sea ice concentration estimated from the same data. Cobalt blue indicates open sea surface with no sea ice coverage. Increase of sea-ice covered areas is indicated by colors varying from cobalt blue to white. The arrows superimposed on the map shows sea ice motion derived by comparing AMSR data acquired at 8:30 p.m. and that from the same day about 10 hours before. It can be seen that sea ice is advancing southward from northern part of the Sea of Okhotsk and reaching to the Shiretoko Peninsula. This year, the sea ice is advancing southward faster than in other years. At the Abashiri weather station in Hokkaido, Japan, approaching sea ice was observed on January 11th at the first time.
| ||||||
2003/1/6
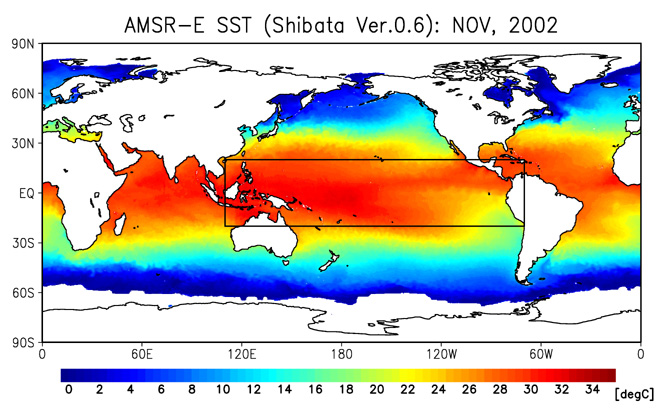
2002/03 El Niño Event Observed from Aqua AMSR-EThe sea surface temperature over the central and eastern equatorial Pacific has increased slowly since early 2002, and the first El Niño event in the 21st century reached maturing in November 2002. Figure 1 shows the monthly mean global sea surface temperature in November 2002 retrieved from the Advanced Microwave Scanning Radiometer for EOS (AMSR-E), which was developed by the National Space Development Agency of Japan (JAXA). AMSR-E has been flown carried on NASA's Aqua satellite since May 2002. The sea surface temperature retrieval algorithm was developed by Dr. Shibata of the Meteorological Research Institute. Figure 2 presents a close-up view of the black rectangle in Fig. 1.
Figure 1:Monthly mean global sea surface temperature in November 2002 retrieved from the AMSR-E
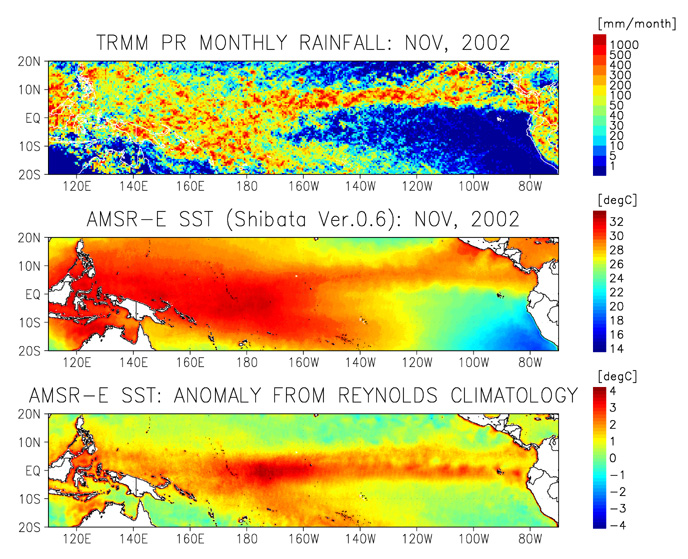
Figure 2:Close-up view (TRMM PR, AMSR-E SST, AMSR-E SST: Anomaly from Reynolds Climatology)
The upper panel of Fig. 2 despites monthly accumulated rainfall of the same month observed by the Precipitation Radar (PR) on board the Tropical Rainfall Measuring Mission (TRMM) satellite. TRMM is a joint mission between Japan and the US. PR, which was developed by the Communications Research Laboratory and JAXA, is the first space-borne precipitation radar. The middle panel of Fig. 2 illustrates the monthly mean sea surface temperature retrieved from AMSR-E observation. These two images clearly illustrate that the warmer sea surface temperature regions (orange to red) correspond well to the heavy rainfall regions (yellow to red). Also, the lower panel of Fig. 2 indicates the differences of monthly mean sea surface temperature from normal years. The sea surface temperature is 2 to 3ºC higher than that of a normal year over the central equatorial Pacific and about 1.5ºC higher over the eastern equatorial Pacific.
Since the El Niño event of 1997 and 98 was the largest on record, sea surface temperatures over the central and eastern equatorial Pacific were 4 to 5ºC higher than normal. The El Niño event is now relatively small, and the peak sea surface temperature anomalies are located over the central equatorial Pacific. Since the variation of sea surface temperature distribution generates tropical convective activities, it significantly affects the distribution of rainfall all over the world. When El Niño or La Niña, which is the opposite event of El Niño, occurs it they causes various abnormal weather conditions such as droughts or heavy rainfall.
You can also find information on the development of El Niño on the EORC TRMM Web site.. In addition, a new home page of AMSR-E daily browse image, including brightness temperatures and some geophysical products, became available to the public in January 2003.
Related Links
1997/98 El Niño Observed by Earth Observation Satellite
|