Japan Aerospace Exploration Agency Earth Observation Research Center ALL RIGHTS RESERVED.

|
2002/6/25
Current status of AMSR-EThe Advanced Microwave Scanning Radiometer for EOS (AMSR-E) on board Aqua had anomaly since 15th May. For the recovery, the command for shifting to observation mode was sent on 29th May. Then, the telemetry and observation data have been normally transmitted since 2:39 a.m. 30th May (Japan Time), and the observation data has indicated normal non-zero values. At the beginning of anomalies, the glitches of telemetry and observation data were found with the frequency of one in several hours (about 5% of total received data per day). After that, the percentage of glitches was reduced to about 0.1 to 0.2% and now almost undistorted data of whole earth has been received. Aqua and other sensors except AMSR-E are now under functional testing and continue their operations normally.
| ||||||
2002/6/12
AMSR-E First-light ImagesThe Advanced Microwave Scanning Radiometer for EOS (AMSR-E) began operating in observation mode and sending science data. Two kinds of images were derived from the first acquired data, color composite images and sea-surface temperature through clouds.
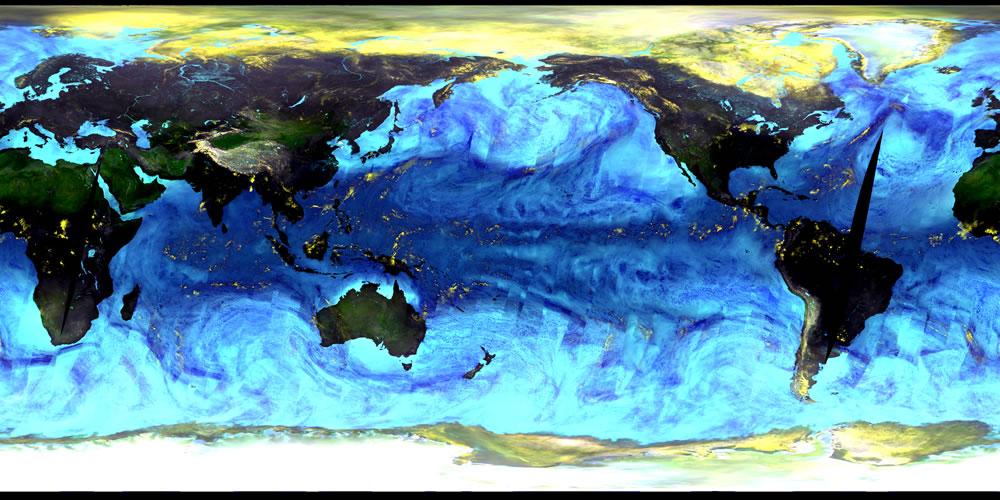
Color Composite Images
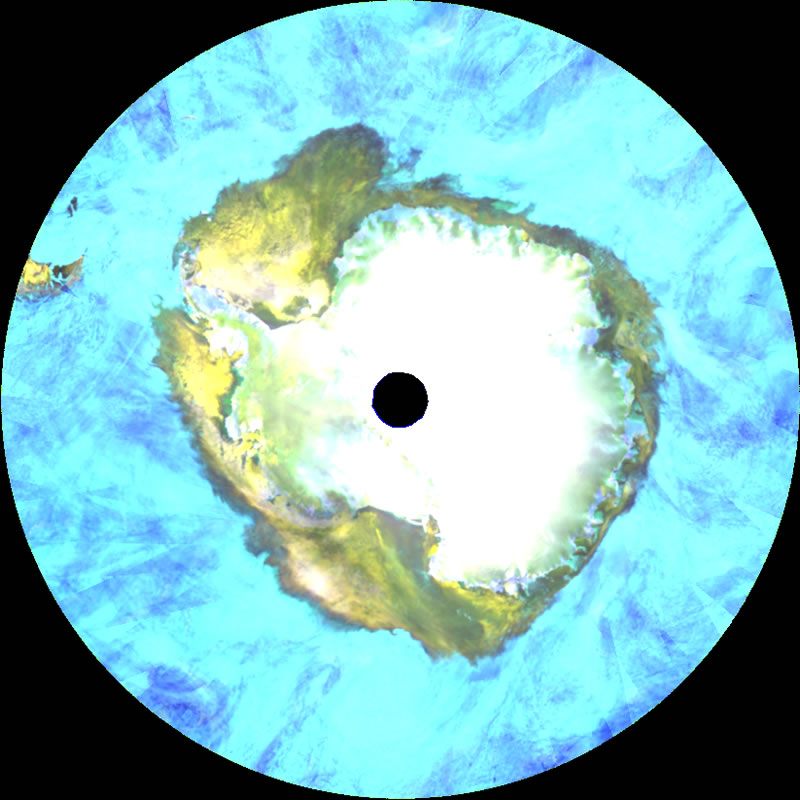
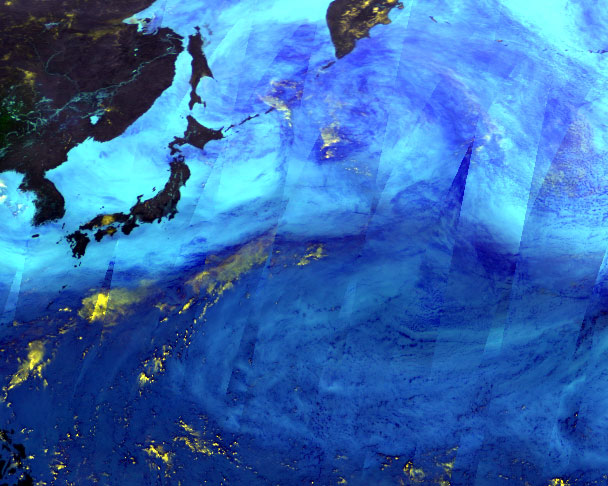
Images are from three-day averaged data (June 2-4 UTC, 2002) of AMSR-E descending paths. Brightness temperatures of 89.0-GHz (both vertical and horizontal polarization) and 23.8-GHz (vertical polarization) channels were used. Black indicates missing data. Areas around the north and south poles are black since AMSR-E is not able to acquire data in those areas. The upper image is the global map. Over the oceans, cold temperatures, which usually correspond to strong precipitation areas, are highlighted by bright yellow; colors varying from aqua to dark blue correspond to increases of water vapor and clouds. Snow coverage, dry and cold land surfaces, and sea-ice distribution in both polar regions are also indicated by bright yellow. The lower-left image shows the Antarctic polar region with a different map projection. The sea-ice region is represented in bright yellow; ice sheets over the continent, in white. The lower-right image is a close-up view around Japan. Precipitation areas in the Bai-u front (rain front) lying to the south of Japan are observed in the image. After the beginning of the Bai-u season in Okinawa (May 10), the rain front moved southward but it was again located near Okinawa during this period.
-- Large Images (JPEG) --
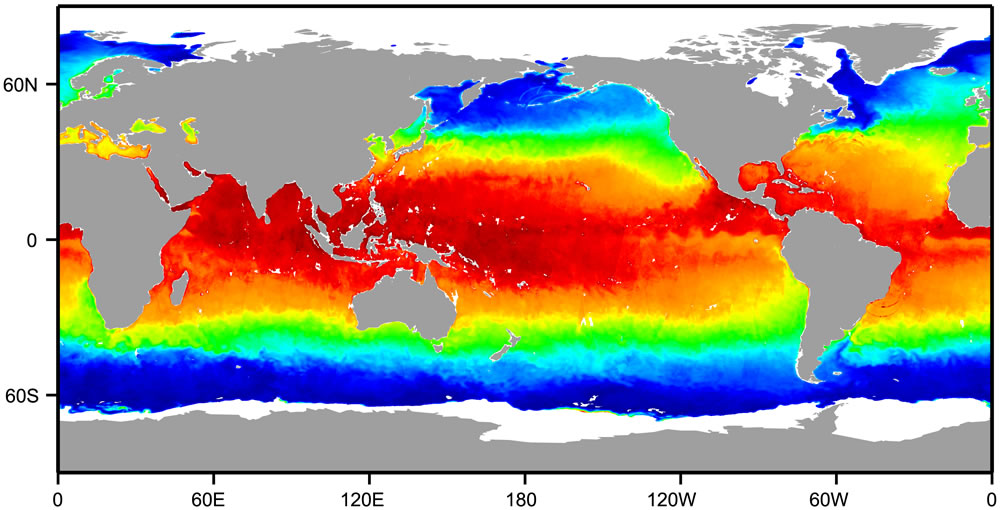
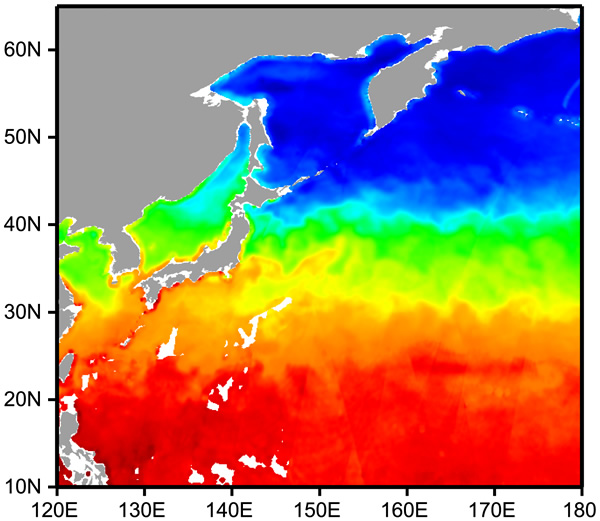
Sea Surface Temperature through Clouds
Three-day average data (June 2-4 UTC, 2002) of sea-surface temperature (SST) was acquired. SST was estimated by using the 6.925-GHz vertical polarization channel, with atmospheric and sea-surface wind corrections by other frequency channels. The greatest advantage of microwave observation is the capability to estimate SST through clouds. In addition, the 6.925-GHz channels enable us to observe SST over the global oceans including cold SST regions, while the TRMM/TMI 10-GHz channels are only appropriate for warmer SST regions. Land areas are masked in gray, and white indicates areas with missing data due to the presence of sea ice and strong precipitation. Many of the higher SST values along coastlines are not real but result from microwave emission from land areas. This effect will be improved by algorithm validation. Almost the entire ocean area is covered by short-term observation, as shown in the upper global image. The lower image is a close-up view around Japan. The Kuroshio Current lying in the ocean off eastern Japan is clearly observed (orange).
-- Large Images (JPEG) --
| ||||||