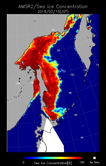
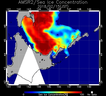
The above images show the sea ice concentration estimated from the data acquired by AMSR2(Advanced Microwave Scanning Radiometer-2). Sea ice concentration is a ratio of ice cover per unit area. The open water area is 0% and the sea ice covered are is 100%. In this image, the sea ice concentration below 10% is cut down to 0%. The white indicates unobserved area.
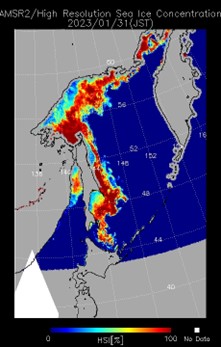
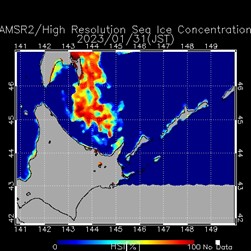
The image above is a high-resolution sea ice concentration image estimated from AMSR2 89GHz observation data. The use of 89 GHz data with high spatial resolution allows us to see detailed sea ice distribution.
The AMSR2 onboard the GCOM-W satellite is a remote sensing instrument for measuring weak microwave emission from the surface and the atmosphere of the Earth. From about 700 km above the Earth, AMSR2 will provide us highly accurate measurements of the intensity of microwave emission and scattering.
A point to note is that there could be errors in estimating along the coast line. Additionally, the error will appear when a heavy low pressure system passes.
 Description of SGLI Images
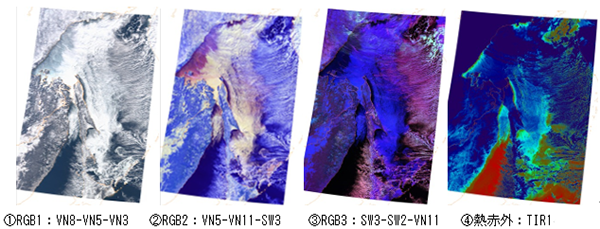
Fig. SGLI reflectance and brightness temperature images (7 March 2018)
A total of four types of SGLI images are available.
① is a true color image, ② is a false color image with infrared information. ③ is a composite image in which sea ice and clouds are easily distinguished from each other. ④ is a thermal infrared image used to measure the temperature of objects.
In ①, sea ice, snow cover, and clouds all appear white. In ②, vegetation areas appear green, sea ice and snow cover areas yellow, clouds white, and the sea surface black. In ③, low-level clouds appear pink, high-level clouds appear green, and sea ice and snow cover appear blue. Therefore, it is easier to distinguish between clouds and sea ice than in ②. In ④, low-temperature areas are colored indigo to light blue, and high-temperature areas are colored orange to red.
Description of VIIRS Images
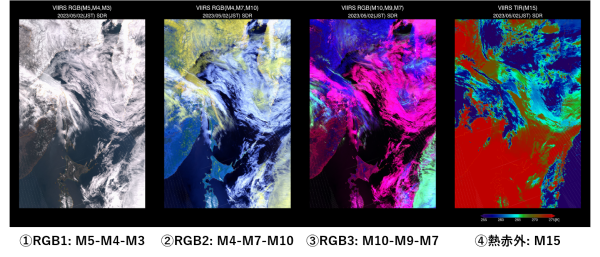
Fig. VIIRS reflectance and brightness temperature images (2 May 2023)
VIIRS is an optical sensor onboard NASA's Suomi NPP earth observation satellite and NOAA/NASA's JPSS1 earth observation satellite.
① is a true color image, ② is a false color image with infrared information. ③ is a composite image in which sea ice and clouds are easily distinguished from each other. ④ is a thermal infrared image used to measure the temperature of objects.
In ①, sea ice, snow cover, and clouds all appear white. In ②, vegetation areas appear green, sea ice and snow cover areas yellow, clouds white, and the sea surface black. In ③, low-level clouds appear pink, high-level clouds appear green, and sea ice and snow cover appear blue. Therefore, it is easier to distinguish between clouds and sea ice than in ②. In ④, low-temperature areas are colored indigo to light blue, and high-temperature areas are colored orange to red.
Related Links


 Description of Images