Updated June 17th, 2025
1. Introduction
1.1. What is the Global Satellite Mapping of Precipitation (GSMaP)?
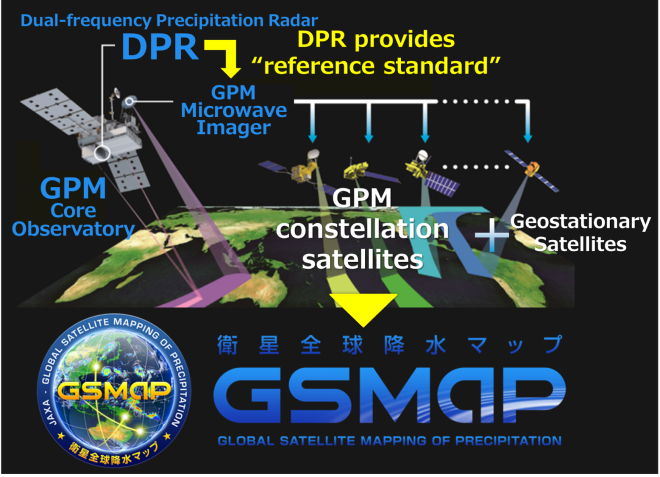
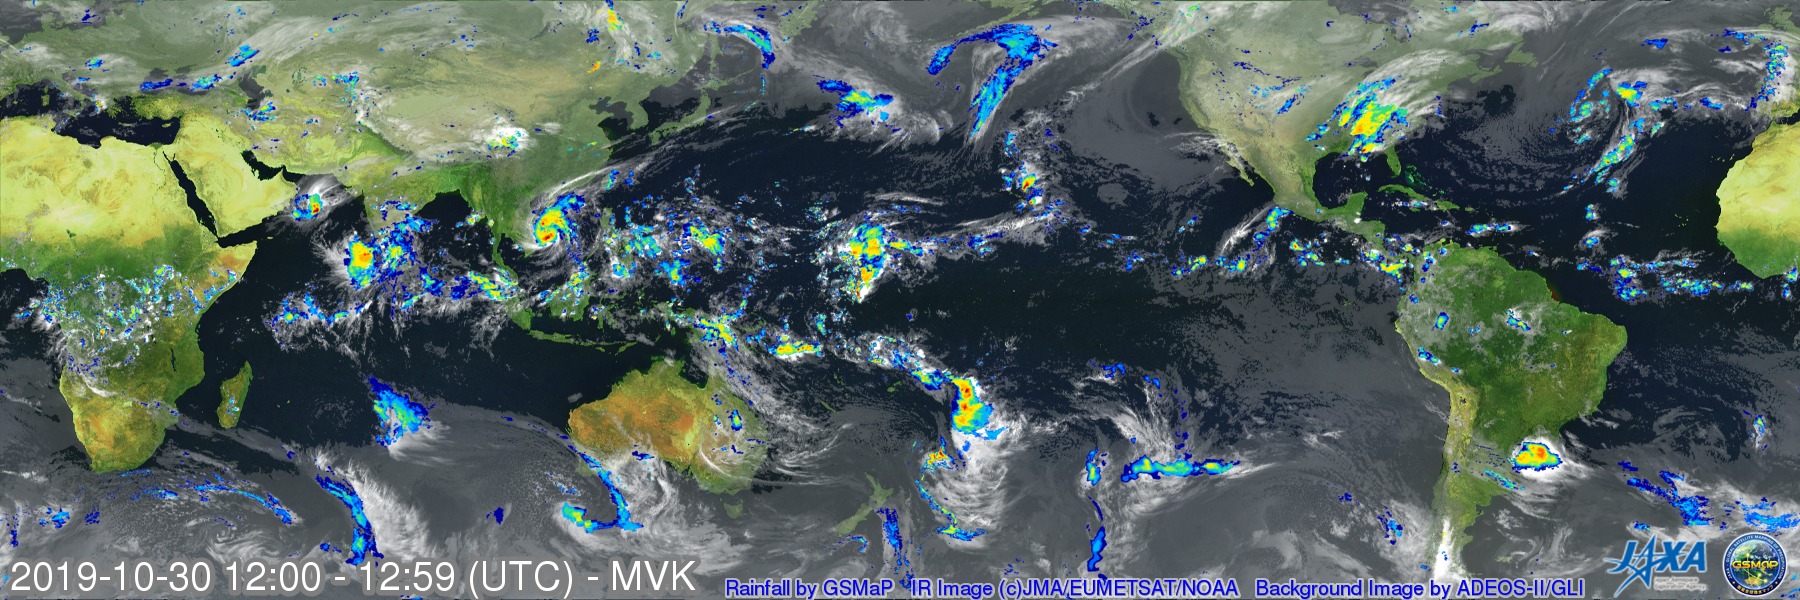
GSMaP has multi-satellite global precipitation map under the Global Precipitation Measurement (GPM) Mission, by using Dual-frequency Precipitation Radar (DPR) onboard GPM core satellites, other GPM constellation satellites, and Geostationary satellites. This website offers hourly global precipitation information.
The main feature of the GSMaP algorithm is utilization of various attributes derived from the spaceborne precipitation radar, TRMM/PR and GPM/DPR.
Precipitation information by GSMaP has been widely used, not only for scientific purposes, but also for meteorology, disaster preventions, climate monitoring, agricultural monitoring, public health, educations and so on. For specific examples, please see the Utilization book.
1.2. Features of the JAXA Rainfall Watch website series
We offers some websites for various utilization purposes. Here is the quick introduction of the major websites.
 |
For users who would like to monitor precipitation in realtime ...JAXA REALTIME RAINFALL WATCH You can see global precipitation map, updated every 30 minutes. |
 |
For users who would like to see precipitation in the past specific date ...JAXA GLOBAL RAINFALL WATCH You can see hourly global precipitation map since March 2000. |
 |
For users who would like to see daily or monthly precipitation ...JAXA CLIMATE RAINFALL WATCH You can see indices related to extreme heavy rainfall and drought as well as accumulated precipitation. |
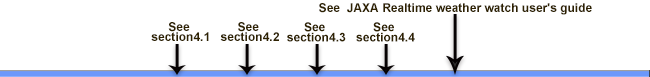
Detailed explanation of the websites above and other applicational GSMaP-related websites such as “GSMaP RIKEN Nowcast” and “JAXA Realtime Weather Watch” are explained more in detail in Section 4.
1.3. History of the GSMaP development
GSMaP is based on the heritage of the study "Production of a high-precision, high-resolution global precipitation map using satellite data," sponsored by Core Research for Evolutional Science and Technology (CREST) of the Japan Science and Technology Agency (JST) during 2002-2007.
Since 2007, GSMaP development has been promoted by the JAXA Precipitation Measuring Mission (PMM) Science Team. JAXA has been updating the algorithms to provide more accurate precipitation information.
Currently, the website displays precipitation estimated by using GPM-GSMaP Ver.6 algorithm developed by the Global Satellite Mapping of Precipitation (GSMaP) project, which is the same as the product distributed from G-Portal.
2. Description of rainfall data
- Variable
- Rainfall rate (mm/hr)
- Domain
- Global (60N - 60S)
- Grid resolution
- 0.1 degree latitude/longitude
- Temporal resolution
- 1 hour
3. GSMaP Utilization
JAXA/EORC provides GSMaP image/data in various format. Please refer to the following subsections for details.
In general, anyone wishing to publish any results using the data from the JAXA Global Rainfall Watch System should clearly acknowledge the ownership of the data in the publication (for example, ' Global Rainfall Map (GSMaP) by JAXA Global Rainfall Watch' was produced and distributed by the Earth Observation Research Center, Japan Aerospace Exploration Agency). Also, please check Terms of Use for details from here. When you use the GSMaP rainfall products in papers, please cite the major papers listed in Section 10.
3.1. Monitor the rainfall using the JAXA Global Rainfall Watch website
① Quick explanation is here
② Graph explanation is here
③ How to use the website “JAXA Climate Rainfall Watch”
④ Displayed images and its data source
- Background cloud images use Globally-merged, full-resolution (~4km) IR Data, produced by NOAA Climate Prediction Center (CPC). Data uses infrared (IR) information observed by the geostationary satellites, including the Himawari satellite by the Japan Meteorological Agency (JMA), the GOES satellites by U.S. National Oceanic and Atmospheric Administration (NOAA), and the Meteosat satellites by the European Meteorological Satellites Organization (EUMETSAT). Those data are provided through NASA/GSFC Precipitation Processing System (PPS).
- Black areas sometime shown in browse images indicate missing of cloud data on an irregular base by several reasons such as delay of data delivery or satellite operation status.
- Since rainfall estimates are calculated mainly based on microwave radiometer observation, rainfall data will not be missing even if cloud image is missing in that pixel.
- Coastline, lat/lon line, and river line are provided by Natural Earth(http://www.naturalearthdata.com/)
3.2. Using Image of the GSMaP rainfall
① Displayed image in the website can be downloaded via website as png format. Please see here.
② Global-scale image of GSMaP rainfall can be downloaded as jpg format from here.
③ In addition, distribution website for high-resolution global-scale image of GSMaP rainfall is also ready. Please contact .

3.3. Analyzing data
GSMaP data in binary/csv format is freely available from password-protected ftp site.
Please register from here to get data.
Data format description file is available from here (PDF).
4. Various GSMaP websites
JAXA Rainfall Watch and related websites are linked each other.


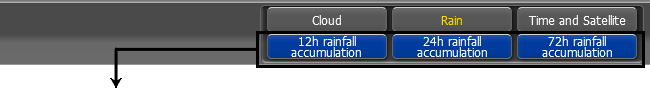
The period indicated by each accumulated rainfall (12h/ 24h/ 72h) is as shown in the table below.
*In the case that the specified date is 2021/03/01 9:00 UTC.
| Date | Period | |
|---|---|---|
| 12h rainfall accumulation | 2021/3/1 9:00 - 9:59 | 2021/2/28 22:00 - 2021/3/1 9:59 |
| 24h rainfall accumulation | 2021/3/1 9:00 - 9:59 | 2021/2/28 10:00 - 2021/3/1 9:59 |
| 72h rainfall accumulation | 2021/3/1 9:00 - 9:59 | 2021/2/26 10:00 - 2021/3/1 9:59 |
4.1. JAXA Global Rainfall Watch
The JAXA Global Rainfall Watch are available from March 2000 by using the combined MW-IR algorithm. The algorithms are different depending on the how long it is before from current hour, as shown in the following figure. The accuracy for past products is higher than its for realtime product. In addition, Gauge-adjusted version is also available. Please refer the following links.
JAXA Super Computer System (JSS2) was used in processing of the reanalysis versions.
4.2. JAXA Realtime Rainfall Watch (GSMaP_NOW)
The JAXA Realtime Raindall Watch website is mainly for monitoring current precipitation distribution. It provides the quasi-realtime precipitation information and is updated every 30 minutes.
GSMaP Realtime (GSMaP_NOW) had been provided within Asia-Pacific region (GEO-Himawari) since November 2015. The domain of it was extended to the Europe-Africa region (GEO-Meteosat) since November 2018, and then it has been available in whole globe including US region (GEO-GOES) since June 2019.
To provide rainfall data in real time, the data available only within 30 minutes is used. Please refer here to the detail information for input data of GSMaP_NOW.
4.3. JAXA Climate Rainfall Watch (GSMaP_CLM)
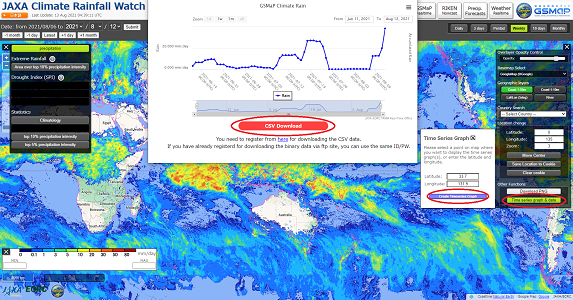
The JAXA Climate Rainfall Watch website provides statistical variables for daily, 3-days, pentad, weekly, 10-days and monthly including mean values and indices for extremes and drought. The product is also utilized for the Space-based Weather and Climate Extremes Monitoring Demonstration Project led by World meteorological Organization (WMO), and available since April 2000. Please have a look at the video showing how to use the website.
For detecting extreme rainfall, percentiles of rain rate are displayed. Darker color indicates more severe extreme rainfall. As for droughts, Standardized Precipitation Index (SPI) is used. If you hover the mouse cursor over the banner, detailed explanations are available. The statistics that can be displayed depend on the category, please refer the table below.
| Category | Mean Precipitation |
Extreme Rainfall |
Drought Index (SPI) |
Statistics | |||
|---|---|---|---|---|---|---|---|
| Climate normals |
% of rainy days in a month |
Top 10% precipitaion intensity |
Top 5% precipitaion intensity |
||||
| Daily | 〇 | 〇 | 〇 | 〇 | 〇 | ||
| 3 days | 〇 | 〇 | 〇 | 〇 | 〇 | ||
| Pentad | 〇 | 〇 | 〇 | 〇 | 〇 | ||
| Weekly | 〇 | 〇 | 〇 | 〇 | 〇 | ||
| 10 days | 〇 | 〇 | |||||
| Monthly | 〇 | 〇 | 〇 | 〇 | |||
In addition, for a specific latitude and longitude, click on "Time series graph & data" in the lower right corner of the screen, and then specify the latitude and longitude to download the csv.
Please see Tashima et al. (2020)(https://doi.org/10.1109/JSTARS.2020.3014881)for details of extreme rainfall and drought monitoring using the near-real-time GSMaP product.
4.4. GSMaP RIKEN Nowcast (GSMaP_RNC)
This website provides precipitation forecasts 6 hours in advance using hourly-updated global precipitation data based on satellite observation.
The RIKEN Data Assimilation Research Team (DA team) performs cutting-edge research on weather forecasting by integrating computer simulations and observation data.
Based on an advanced data assimilation technique, we developed a precipitation nowcasting system* that provides precipitation forecasts.
Operation of the nowcast system involves hourly updates and accuracy verification, and results are used for research purposes.
JAXA distributes GSMaP RNC binary data generated by RIKEN.
If you would like to get them, please register from here, which is same registration as other GSMaP product.
NO FORECAST area
We acquired the weather forecasting license from the Japan Meteorological Agency (JMA) for the area surrounding Japan defined by 0-60oN and 100-180oE, and provide the precipitation forecasts from 10 am to 5 pm on weekdays. Areas on the map shaded in gray indicate out-of-service locations.
Release note
Please note that the weather forecasts on this website can differ from weather forecasts provided by the JMA. Please give precedence to the latest warnings and advisories from the JMA. Use of information or data from this website is undertaken at the user's own risk. JAXA and RIKEN takes no responsibility for any direct or indirect damage that may arise through the use of this information or data. Any part or all of this website may be changed, deleted, or removed without notice.
More detail explanation and notes are available in RIKEN DA Team "GSMaP RIKEN nowcast (GSMaP_RNC)".
*Reference
1. Otsuka, S., S. Kotsuki, and T. Miyoshi, 2016: Nowcasting with data assimilation: a case of Global Satellite Mapping of Precipitation. Wea. Forecasting, 31, 1409-1416.
5. Algorithm inputs
1) Geostationary satellite data
In the GSMaP products except for the GSMaP_NOW, Globally-merged, full-resolution (~4km) IR Data, produced by NOAA/CPC, has been used. This IR data is merged from the ~11 micron IR channels from geostationary meteorological satellites of the Japan Meteorological Agency, the EUMETSAT, and the NOAA. The range of the latitude is 60N-60S. The temporal resolution is 1 hour in this product
As for GSMaP Realtime (GSMaP_NOW) , Himawari data from Japan Meteorological Agency, GOES data from the Chiba University and/or Instituto Nacional de Pesquisas Espaciais (INPE), and Meteosat data from EUMETSAT are used and merged to provide rainfall data in real time.
The IR data of the reanalyzed version (GSMaP_RNL) from January 1, 1998 to February 8, 2000 uses NOAA's GridSat-B1. Please see here for more detailed instructions and notes.
2) Low Earth Orbit satellite data
Because of the operational period of satellite and sensors, used satellite sensors are different depending on the data period. For the detail information, please refer to the satellite flag data.
As for GSMaP Realtime (GSMaP_NOW) , the data available within 30 minutes (GMI Core, data received at direct readout stations for GCOM-W, NOAA series, and MetOp series) is used to provide rainfall data in real time.
| Satellite | Height (km) | Instrument | Category | frequency (GHz) | Data Period |
|---|---|---|---|---|---|
| GPM Core | 407 | GMI | imager | 10.7, 19.4, 21.3, 37, 85.5, 166, 183.31±3, 183.31±7 | Introduced into GSMaP since 4 Mar. 2014 |
| TRMM | 402 | TMI | imager | 10,19,21,37,85 | Not used since 8 Apr. 2015 |
| AQUA | 705 | AMSR-E | imager | 7,10,19,24,37,89 | Not used since 4 Oct. 2011 |
| GCOM-W | 705 | AMSR2 | imager | 7,10,19,24,37,89 | Introduced into GSMaP since 1 Jul. 2013 |
| DMSP-F11 | 833 | SSM/I | imager | 19,22,37,85 | Not used since 16 May 2000 |
| DMSP-F13 | 833 | SSM/I | imager | 19,22,37,85 | Not used since 19 Nov. 2009 |
| DMSP-F14 | 833 | SSM/I | imager | 19,22,37,85 | Not used since 8 Aug. 2008 |
| DMSP-F15 | 833 | SSM/I | imager | 19,22,37,85 | Not used since 2 Sep. 2014 |
| DMSP-F16 | 833 | SSMIS | imager/ sounder |
19.4, 22.2, 37, 91.7, 60-63, 50-59, 150, 183.31±1, 183.31±3, 183.31±7 |
Introduced into GSMaP since 11 Jun. 2010 |
| DMSP-F17 | 850 | SSMIS | imager/ sounder |
19.4, 22.2, 37, 91.7, 60-63, 50-59, 150, 183.31±1, 183.31±3, 183.31±7 |
Introduced into GSMaP since 19 Mar. 2008 Not used since 9 Nov. 2016 |
| DMSP-F18 | 850 | SSMIS | imager/ sounder |
19.4, 22.2, 37, 91.7, 60-63, 50-59, 150, 183.31±1, 183.31±3, 183.31±7 |
Introduced into GSMaP since 20 Oct. 2011 |
| DMSP-F19 | 850 | SSMIS | imager/ sounder |
19.4, 22.2, 37, 91.7, 60-63, 50-59, 150, 183.31±1, 183.31±3, 183.31±7 |
Introduced into GSMaP since 18 Dec. 2014 Not used since 11 Feb. 2016 |
| NOAA-N15 | 833 | AMSU-A/B | imager/ sounder |
23.8-89.0 (AMSU-A), 89, 150, 183.31±1, 183.311±3, 183.311±7 (AMSU-B) |
Not used since 30 Nov. 2010 |
| NOAA-N16 | 833 | AMSU-A/B | imager/ sounder |
23.8-89.0 (AMSU-A), 89, 150, 183.31±1, 183.311±3, 183.311±7 (AMSU-B) |
Not used since 31 Dec. 2007 |
| NOAA-N17 | 833 | AMSU-A/B | imager/ sounder |
23.8-89.0 (AMSU-A), 89, 150, 183.31±1, 183.311±3, 183.311±7 (AMSU-B) |
Not used since 30 Nov. 2010 |
| NOAA-N18 | 870 | AMSU-A/ MHS |
sounder | 23.8-89.1 (AMSU-A), 89, 157, 183.311±3, 183.311±5, 190.311 (MHS) |
Introduced into GSMaP since 25 May 2005 Not used since 23 Oct. 2018 |
| NOAA-N19 | 870 | AMSU-A/ MHS |
sounder | 23.8-89.1 (AMSU-A), 89, 157, 183.311±3, 183.311±5, 190.311 (MHS) |
Introduced into GSMaP since 11 Feb. 2009 Not used since 17 Jun. 2025 |
| MetOp-A | 817 | AMSU-A/ MHS |
sounder | 23.8-89.1 (AMSU-A), 89, 157, 183.311±3, 183.311±5, 190.311 (MHS) |
Introduced into GSMaP since 1 Dec. 2006 Not used since 24 Dec. 2019 |
| MetOp-B | 817 | AMSU-A/ MHS |
sounder | 23.8-89.1 (AMSU-A), 89, 157, 183.311±3, 183.311±5, 190.311 (MHS) |
Introduced into GSMaP since 16 Jan. 2013 |
| MetOp-C | 817 | AMSU-A/ MHS |
sounder | 23.8-89.1 (AMSU-A), 89, 157, 183.311±3, 183.311±5, 190.311 (MHS) |
Introduced into GSMaP since 17 Sep. 2020 |
| NPP | 824 | ATMS | sounder | 23.8-183.31±1 | Introduced into GSMaP since 1 Dec. 2021 |
| JPSS-1 | 824 | ATMS | sounder | 23.8-183.31±1 | Introduced into GSMaP since 1 Dec. 2021 |
3) Ancillary Data
- JMA Global Forecast data, and Global Analysis (GANAL) data
- JMA Merged satellite and in situ data Global Daily Sea Surface Temperatures (MGDSST)
6. FAQ
Regarding the use of GSMaP data, we have gathered frequently asked questions in the list.
- Q1. I want to know about the type and period of available GSMaP product.
- Q2. I want to know the specific area of the text data (.csv).
- Q3. I want to know about the detail (parameter, data format, etc.) of the product.
- Q4. I want to know the unit of daily rainfall. /I want to know how to get the daily rainfall data.
- Q5. What does "01:00Z" mean?
- Q6. I want to know about the difference between the products (GSMaP_NOW, GSMaP_NRT, GSMaP_MVK, GSMaP_RNL, GSMaP_Gauge_NRT, GSMaP_Gauge, GSMaP_Gauge_RNL).
- Q7. I want to know what geodetic reference system used to GSMaP.
- Q8. I forgot my user ID, password, URL, so please re-issue it.
- Q9. I am using the correct user ID and password, but I can not access GSMaP.
- Q10. I want to know how to open the data with ArcGIS.
- Q11. I want to know how to open the data. /Can you recommend any software to view/visualize the data?
- Q12. I want to know how to read the data with GrADS, and how to use ".ctl" files.
- Q13. Is it possible to use JAXA Global Rainfall Image on my academic research report?
- Q14. Is it possible to use JAXA Global Rainfall Image for commercial use?
- Q15. I want to know the algorithm used for the GSMaP.
- Q16. I want to use GSMaP data on our web. What is the necessary procedure?
- Q17. What data is GSMaP_RNC?
- Q18. Can I get Data Format Description?
- Q19. I want to download only specific area.
- Q20. I want to know the difference from the GSMaP data provided from G-Portal.
- Q21. How can I change my registered information?
- Q22. I cannot access to GSMaP FTP site with my Web browser.
- Q23. It takes long time to download data from the FTP site.
7. Some caveats for data users
- Although JAXA/EORC has taken every care to manage the current site, JAXA assumes no responsibility regarding the safety of the contents of the Site or the reliability of information provided on the Site. JAXA is not responsible to you for any damage that may be caused by the use of the Site and/or the information on the Site.
- Please contact
 in advance if you want to distribute images or data from this site to many people, such as in a pamphlet or internet. Also, please check Terms of Use for details from here.
 - Anyone wishing to publish any results using the data from the JAXA Global Rainfall Watch System should clearly acknowledge the ownership of the data in the publication (for example, ' Global Rainfall Map (GSMaP) by JAXA Global Rainfall Watch' was produced and distributed by the Earth Observation Research Center, Japan Aerospace Exploration Agency). If you have benefited from GSMaP rainfall products, please cite the major papers listed in Section 10.
- We would appreciate receiving a preprint and/or reprint of publications in which you utilize our data. Relevant publications should be sent to :
GSMaP Real-Time Office Earth Observation Research Center, Japan Aerospace Exploration Agency
2-1-1, Sengen, Tsukuba-city, Ibaraki 305-8505 Japan
Fax +81-29-868-2961
E-mail:
Please contact us at the
if you have any questions.
8. Links
- JAXA/EORC GPM Website
http://www.eorc.jaxa.jp/GPM/index_e.htm - JAXA/EORC TRMM Website
http://www.eorc.jaxa.jp/TRMM/index_e.htm - JAXA/EORC AMSR/AMSR-E Website
http://sharaku.eorc.jaxa.jp/AMSR/index.html - JAXA/EORC GCOM-W Website
http://suzaku.eorc.jaxa.jp/GCOM_W/index.html
9. Acknowledgments
The GSMaP and JAXA Global Rainfall Watch system was developed based on heritage of the GSMaP Project led by Prof. K. Okamoto (Osaka Prefecture University, Osaka, Japan) under R&D of Hydrological Modeling and Water Resources System in the Core Research for Evolutional Science and Technology program of the Japan Science and Technology Agency (JST). We would like to thank JST and the members of the GSMaP Project.
10. Papers describing the GSMaP project
Please refer the following paper :
- Kubota, T., K. Aonashi, T. Ushio, S. Shige, Y. N. Takayabu, M. Kachi, Y. Arai, T. Tashima, T. Masaki, N. Kawamoto, T. Mega, M. K. Yamamoto, A. Hamada, M. Yamaji, G. Liu and R. Oki 2020: Global Satellite Mapping of Precipitation (GSMaP) products in the GPM era, Satellite precipitation measurement, Springer, https://doi.org/10.1007/978-3-030-24568-9_20.
Major papers related to GSMaP algorithms :
- Kubota, T., S. Shige, H. Hashizume, K. Aonashi, N. Takahashi, S. Seto, M. Hirose, Y. N. Takayabu, K. Nakagawa, K. Iwanami, T. Ushio, M. Kachi, and K. Okamoto, 2007: Global Precipitation Map using Satelliteborne Microwave Radiometers by the GSMaP Project : Production and Validation, IEEE Trans. Geosci. Remote Sens., 45, No. 7, 2259-2275, https://doi.org/10.1109/TGRS.2007.895337.
- Aonashi, K., J. Awaka, M. Hirose, T. Kozu, T. Kubota, G. Liu, S. Shige, S., Kida, S. Seto, N.Takahashi, and Y. N. Takayabu, 2009: GSMaP passive, microwave precipitation retrieval algorithm: Algorithm description and validation. J. Meteor. Soc. Japan, 87A, 119-136, https://doi.org/10.2151/jmsj.87A.119.
- T. Ushio, T. Kubota, S. Shige, K. Okamoto, K. Aonashi, T. Inoue, N., Takahashi, T. Iguchi, M.Kachi, R. Oki, T. Morimoto, and Z. Kawasaki, 2009: A Kalman filter approach to the Global Satellite Mapping of Precipitation (GSMaP) from combined passive microwave and infrared radiometric data. J. Meteor. Soc. Japan, 87A, 137-151, https://doi.org/10.2151/jmsj.87A.137.
- Mega, T., T. Ushio, M. T. Matsuda, T. Kubota, M. Kachi, and R. Oki, 2019: Gauge-adjusted global satellite mapping of precipitation. IEEE Trans. Geosci. Remote Sens., 57.4, 1928-1935, https://doi.org/10.1109/TGRS.2018.2870199.
Major papers related to heavy rainfall and drought monitoring using the GSMaP products :
- T. Tashima, T. Kubota, T. Mega, and T. Ushio, and R. Oki, 2020: Precipitation extremes monitoring using the near-real-time GSMaP product, IEEE J. Sel. Topics Appl. Earth Observ. Remote Sens. https://doi.org/10.1109/JSTARS.2020.3014881.
Further references are listed here.