
Updated Jun, 30 2026
This typhoon data set may only be used for the purposes of scientific research. The data are not copyrighted.
We request that when you publish data or research results utilizing these data, please acknowledge as follows:
"'JAXA/EORC Tropical Cyclone Database (Ver. 1.7)' was produced and distribute by the Earth Observation Research Center, Japan Aerospace Exploration Agency."
We request that when you publish data or research results utilizing these data, please acknowledge as follows:
"'JAXA/EORC Tropical Cyclone Database (Ver. 1.7)' was produced and distribute by the Earth Observation Research Center, Japan Aerospace Exploration Agency."
1. Data Set Organization
1-1. Introduction
This site is a database of typhoons (tropical cyclones such as typhoons, hurricanes, and cyclones) occurring around the world.
The database provides information on the duration and path of typhoons, as well as the maximum wind speed for each region.
In addition, the data are extracted from earth observation satellites such as TRMM/PR, TMI, VIRS, GPM/KuPR, GMI, EarthCARE/CPR, ATLID, MSI, GOSAT-GW/AMSR3, GCOM-W/AMSR2, Aqua/AMSR-E, Midori-II /AMSR, EarthCARE/CPR, ATLID, MSI.
Physical quantities such as precipitation and water vapor, etc. are also included in this database.
The format of the data files in this database is HDF/NetCDF format, and the structure is the same as the original product, but the AMSR2/AMSR3 data has some differences (see section 3-3-3).
Users are required to indicate the data sources; an example of acknowledgments and credit lines is follows:
"The data have been provided by JAXA/EORC Tropical Cyclone Database."
Users are required to indicate the data sources; an example of acknowledgments and credit lines is follows:
"The data have been provided by JAXA/EORC Tropical Cyclone Database."
1-2. Data descriptions
- Duration
- Domain
- Products TRMM
- File specifications
| TRMM/PR, TMI, VIRS: | 1997/12/07 to 2015/04/08 |
| *Due to the satellite altitude rise, the data is not available, from August 7 to 24, 2001. | |
| GPM/DPR, GMI: | 2014/03/08 to present |
| GOSAT-GW/AMSR3: | 2025/08/11 to present |
| GCOM-W/AMSR2: | 2012/07/04 to present |
| Aqua/AMSR-E: | 2002/06 to 2011/10/04 |
| Midori-II /AMSR: | 2003/04 to 2003/10 |
| EarthCARE/CPR, ATLID, MSI: | 2025/01/01 to present |
| TRMM/PR, TMI, VIRS: | 36N - 36S |
| GPM/DPR, GMI: | 65N - 65S |
| GOSAT-GW/AMSR3: | Global |
| GCOM-W/AMSR2: | Global |
| Aqua/AMSR-E: | Global |
| Midori-II/AMSR: | Global |
| EarthCARE/CPR, ATLID, MSI: | Global |
| PR: | 2A23, 2A25 |
| TMI: | 1B11, 2A12 |
| VIRS: | 1B01 |
| Product Version |
1997/12/07 to 2001/08/06 |
2001/08/07 to 2001/08/24 |
2001/08/25 to 2004/03/31 |
2004/04/01 to 2011/06/30 |
2011/07/01 to 2015/04/08 |
| 6 | ● | Due to the satellite altitude rise, the data is not available. | ● | ● | - |
| 7 | ● | ● | ● | ● |
| DPR: | 2AKu, 2ADPR |
| GMI: | 2AGMI |
| AMSR: | Level 1B(Brightness Temperature), Level 2 AP0(Precipitation), Level 2 WV0(Total Precipitable Water) |
| AMSR-E: | Level 1B(Brightness Temperature), Level 2 AP0(Precipitation), Level 2 WV0(Total Precipitable Water) |
| AMSR2: | Level 1B(Brightness Temperature), Level 2 PRC(Precipitation), Level 2 TPW(Total Precipitable Water), Level 2 ASW(All-weather Sea Surface Wind Speed) |
| AMSR3: | Level 1B(Brightness Temperature), Level 2 PRC(Precipitation), Level 2 TPW(Total Precipitable Water), Level 2 ASW(All-weather Sea Surface Wind Speed) |
| CPR: | 2ACPR_ECO, 2ACPR_CLP |
| ATLID: | 2AATL_CLA |
| MSI: | 2AMSI_CLP |
HDF format (gzip or internally compressed), NetCDF format (gzip or internally compressed)
2. How to extract the data
2-1. Tropical cyclones dataset
Tracks of tropical cyclones are referred to the followings:
until February 2011: University of Hawaii "Tropical Storms, Worldwide"
until August 2018: Unisys "Weather Hurricane/Tropical Data"
currently: University of Wisconsin "CIMSS Tropical Cyclones Page"
until February 2011: University of Hawaii "Tropical Storms, Worldwide"
until August 2018: Unisys "Weather Hurricane/Tropical Data"
currently: University of Wisconsin "CIMSS Tropical Cyclones Page"
2-2. TRMM/PR
The data is processed automatically based on precipitating areas from TRMM/PR standard product and tracking of tropical cyclones.
- Detection of precipitating areas
- Connection between precipitating area and typhoon tracks
- HDF data specification
Precipitating areas are defined by using TRMM/PR 2A25 dataset. Total values of averaged rainfall intensity of total range bins are calculated for each scan, and precipitating areas are extracted when the 5-scan running mean of the total values gets more than 3 mm/h (rain areas in the figure). If there are any other precipitating areas within 24 scans, they are treated as the same rain area (rain area B including two precipitating areas).
As the next step, the latitude and longitude for the rectangular area (shown as the black square) is identified including all rain area within +/- 5 degrees. Finally, the extracted area is available (shown as the red square).
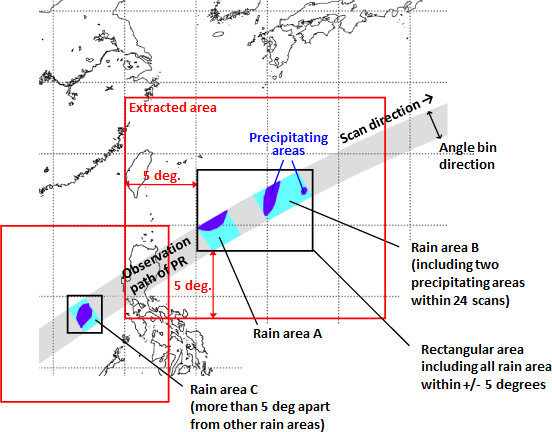
Temporally, cyclones existing 6 hours before/after the observation time of the TRMM/PR orbit become the subject to be processed.
Spatially, products are produced when there are cyclones locating within red or black squares in the figure.
Final product includes data within the red square area. The data can be overlapped as processing is running for each cyclones.
Some of the products, which can be inappropriate judged from the cloud and other images, are excluded from the product list, or adjusted the areas. The HDF data files are available after compressing (gzip).
2-3. GPM
The same method as TRMM/PR is applied to GPM L2 product.
2-4. AMSR/AMSR-E/AMSR2/AMSR3
The data is processed automatically based on locations of tropical cyclones.
- Acquisition of track data
- Extracted data
- HDF/NetCDF data specification
Tracks of tropical cyclones are referred to the followings:
until February 2011: University of Hawaii "Tropical Storms, Worldwide"
until August 2018: Unisys "Weather Hurricane/Tropical Data"
currently: University of Wisconsin "CIMSS Tropical Cyclones Page"
until February 2011: University of Hawaii "Tropical Storms, Worldwide"
until August 2018: Unisys "Weather Hurricane/Tropical Data"
currently: University of Wisconsin "CIMSS Tropical Cyclones Page"
The location of typhoon, when AMSR/AMSR-E/AMSR2/AMSR3 passes over the 25 degrees north latitude, is estimated from cyclone tracking data. If the center position of observation path locates +/- 15 degrees of the estimated typhoon, the product are extracted as the Tropical Cyclone Database dataset.
Dataset around the cyclones (from -97 line to + 98 line, a total of 196 lines; for AMSR2/AMSR3, from -121 line to +122 line, a total of 243 lines) is extracted.
The HDF/NetCDF data format is similar to original AMSR/AMSR-E/AMSR2/AMSR3 data.
Some changes of data format from original data are as follows.
Table. The changes of data format between Tropical Cyclones Data and original data (AMSR3)
Core Meta Items
| Items (Attribute Name) | Values |
|---|---|
| ProductName | AMSR3-L1B:AMSR3 L1B TBB TY |
| AMSR3-L2PRC:AMSR3 L2 PRC TY | |
| AMSR3-L2ASW:AMSR3 L2 ASW TY | |
| AMSR3-L2TPW:AMSR3 L2 TPW TY | |
| FileSizeByte | The size (byte) of Tropical Cyclones Data is set |
| ProductCreationDateTime | The production date (UTC) of Tropical Cyclones Data is set |
| date_created | The production date (UTC) of Tropical Cyclones Data is set |
| ObservationStartDateTime | The start scan time (UTC) of Tropical Cyclones Data is set |
| time_coverage_start | The start scan time (UTC) of Tropical Cyclones Data is set |
| ObservationEndDateTime | The end scan time (UTC) of Tropical Cyclones Data is set |
| time_coverage_end | The end scan time (UTC) of Tropical Cyclones Data is set |
| GringPointLatitude | The valid latitude of Tropical Cyclones Data is set |
| GringPointLongitude | The valid longitude of Tropical Cyclones Data is set |
| geospatial_bounds | The valid latitude and longitude of Tropical Cyclones Data is set |
| NumberOfScans | The number of scans of Tropical Cyclones Data (243) is set |
Data Item and Size
| Items | Values |
|---|---|
| All | Scan number is changed to 243 |
Table. The changes of data format between Tropical Cyclones Data and original data (AMSR2)
Core Meta Items
| Items (Attribute Name) | Values |
|---|---|
| ProductName | AMSR2-L1B:AM2L1BTY |
| AMSR2-L2:AM2L2TY | |
| ProductSize_MByte | The size (MByte) of Tropical Cyclones Data is set |
| ProductionDateTime | The production date (UTC) of Tropical Cyclones Data is set |
| ObservationStartDateTime | The start scan time (UTC) of Tropical Cyclones Data is set |
| ObservationEndDateTime | The end scan time (UTC) of Tropical Cyclones Data is set |
| GringPointLatitude | The valid latitude of Tropical Cyclones Data is set |
| GringPointLongitude | The valid longitude of Tropical Cyclones Data is set |
| NumberofScans | The number of scans of Tropical Cyclones Data (243) is set |
Data Item and Size
| Items | Values |
|---|---|
| All except Spill_Over | Scan number is changed to 243 |
Table. The changes of data format between Tropical Cyclones Data and original data (AMSR/AMSR-E)
Core Meta Items
| Items (Attribute Name) | Values |
|---|---|
| ShortName | AMSR/L1B:AMSL1BTY |
| AMSR/L2:AMSL2TY | |
| AMSR-E:AMEL1BTY | |
| AMSR-E:AMEL2TY | |
| SizeMBECSDataGranule | The size (MByte) of Tropical Cyclones Data is set |
| ProductionDateTime | The production date (UTC) of Tropical Cyclones Data is set |
| RangeBeginningTime | The start scan time (UTC) of Tropical Cyclones Data is set |
| RangeBeginningDate | The start scan date (UTC) of Tropical Cyclones Data is set |
| RangeEndingTime | The end scan time (UTC) of Tropical Cyclones Data is set |
| RangeEndingDate | The end scan date (UTC) of Tropical Cyclones Data is set |
| GringPointLatitude | The valid latitude of Tropical Cyclones Data is set |
| GringPointLongitude | The valid longitude of Tropical Cyclones Data is set |
| NumberofScans | The number of scans of Tropical Cyclones Data (196) is set |
Data Item and Size
| Items | Values |
|---|---|
| All except Spill_Over | Scan number is changed to 196 |
2-5. EarthCARE
The data is processed automatically based on precipitating areas from JAXA standard product and tracking of tropical cyclones.
- Extracted data
- HDF data specification
The matchup time when the satellite passed near the typhoon's center is identified by using EarthCARE orbit data and Tropical cyclones dataset.
For the frame data corresponding to the matchup time, if CPR observation data exists within +/- 5 degrees of the radius of the matched typhoon center, the CPR/ATLID/MSI products are extracted as the Tropical Cyclone Database dataset.
Dataset around the cyclones (a total of 1000 rays centered on the typhoon's position) is extracted.
The data can be overlapped as processing is running for each cyclones.
Some of the products, which can be inappropriate judged from the cloud and other images, are excluded from the product list, or adjusted the areas.
3. Product
3-1. TRMM/PR
3-1-1. File specification
File names include product name, observation time, orbit number, product version, cyclone number and typhoon name.
| 2A25 | . | 010910 | . | 21804 | . | 7 | . | 19W | . | DANAS | . | HDF |
| product name | observation time | orbit number | product version |
cyclone number |
typhoon name | extension |
- Product version
- Orbit number
The product version is consistent with the version of TRMM product.
The orbit number is same as that of TRMM files.
HDF files are distributed via this website. The current HDF version is 5.
3-1-2. TRMM/PR product
Detail information for TRMM/PR product is as follows.
- TRMM Data Users Handbook (PDF 3.7MB)
- APPENDIX PARAMETER DICIONARY (PDF 1.7MB)
3-1-3. Major variables
| Physical Quantity | Product No | Element | Array | Unit |
|---|---|---|---|---|
| Rain Type | 2A23 | rainType | nscan*49 | - |
| Height of Bright Band | 2A23 | HBB | nscan*49 | m |
| Height of storm top | 2A23 | stormH | nscan*49 | m |
| Attenuation corrected reflectivity factor (Z) | 2A25 | correctZfactor | nscan*49*80 | dBZ |
| Rainfall rate | 2A25 | rain | nscan*49*80 | mm/h |
| Rainfall rate near the surface | 2A25 | nearSurfRain | nscan*49 | mm/h |
| Physical Quantity | Product No | Element | Array | Unit |
|---|---|---|---|---|
| Brightness temperature 10,19,37GHz Horizontal/Vertical 21GHz Vertical |
1B11 | lowResCh | nscan*7*104 | K |
| Brightness temperature 85GHz Horizontal/Vertical |
1B11 | highResCh | nscan*2*208 | K |
| Instantaneous rain rate | 2A12 | surfaceRain | nscan*208 | mm/h |
| Total cloud liquid water in the column | 2A12 | cldWater | nscan*14*208 | g/m3 |
| Total rain water in the column | 2A12 | precipWater | nscan*14*208 | g/m3 |
| Physical Quantity | Product No | Element | Array | Unit |
|---|---|---|---|---|
| Scene data for the channels, measured in Radiance | 1B01 | channels | nscan*5*261 | mW/cm2um*sr |
3-2. GPM/DPR
3-2-1. File specification
File names include product name, observation time, orbit number, product version, cyclone number and typhoon name.
| 2ADPR | . | 20150922 | . | 008902 | . | 03B | . | 21W | . | DUJUAN | . | h5 |
| product name | observation time | orbit number | product version |
cyclone number |
typhoon name | extension |
- Product version
- Orbit number
The product version is consistent with the version of GPM product.
The orbit number is same as that of GPM files.
HDF files are distributed via this website. The current HDF version is 5.
3-2-2. GPM/DPR product
Detail information for GPM/DPR product is as follows.
https://www.eorc.jaxa.jp/GPM/en/archives.html
https://www.eorc.jaxa.jp/GPM/en/archives.html
3-2-3. Major variables
| Physical Quantity | Product No | Element | Array | Unit |
|---|---|---|---|---|
| Precipitation type | 2AKu, 2ADPR | CSF-typePrecip | nscan*49 | - |
| Height of bright band | 2AKu,2ADPR | CSF-heightBB | nscan*49 | m |
| Height of storm top | 2AKu,2ADPR | PRE-heightStormTop | nscan*49 | m |
| Vertical profile of reflectivity factor with attenuation correction | 2AKu,2ADPR | SLV-zFactorCorrected | nscan*49*176 | dBZ |
| Precipitation rate | 2AKu,2ADPR | SLV-precipRate | nscan*49*176 | mm/h |
| Precipitation rate for the nearSurface | 2AKu,2ADPR | SLV-precipRateNearSurface | nscan*49 | mm/h |
3-3. AMSR/AMSR-E/AMSR2/AMSR3
3-3-1. File specification
The file names of HDF/NetCDF data in this database include satellite and sensor name, start date of observations, path number, A/D classification, product codes, product version, typhoon number, and extension (HDF/NetCDF).
AMSR3
| GGW | AM3 | _ | 20260604 | A | 021 | _ | S2MTPW | _ | 01A | _ | 06W | . | nc |
| satellite name |
sensor name |
start date of observations | A/D classification |
path number |
product codes |
product version |
typhoon number |
extension |
AMSR2
| GW1 | AM2 | _ | 20130915 | 208 | A | _ | SNTPW | _ | 01 | _ | 16W | . | h5 |
| satellite name |
sensor name |
start date of observations | path number |
A/D classification |
product codes |
product version |
typhoon number |
extension |
AMSR/AMSR-E
| P1 | AME | 20040405 | 097 | MD | _ | P2AP0 | _ | 01 | _ | 03W | . | HDF |
| satellite name |
sensor name |
start date of observations | path number |
A/D classification |
product codes |
product version |
typhoon number |
extension |
- Satellite name
- Sensor name
- Start date of observations
- Path number
- A/D classification
- Typhoon number
GGW, GW1, P1 and A2 indicate GOSAT-GW, GCOM-W, EOS-PM1 and ADEOS-2, respectively.
AM3, AM2, AME and AMS indicate AMSR3, AMSR2, AMSR-E and AMSR, respectively.
Start date of observations in UTC from original standard product.
Consistent with the path number of AMSR/AMSR-E/AMSR2/AMSR3.
Ascending (from south to north) or Descending (from north to south).
English character and number indicate area and orders of cyclones, respectively.
| W | : North Western Pacific (West of the date line) |
| C | : North Central Pacific (date line - 140W) |
| E | : North Eastern Pacific (East of 140W) |
| L | : North Atlantic |
| A , B | : North Indian Ocean |
| S , P | : South Indian Ocean and South Pacific |
HDF/NetCDF files are distributed via this website.
3-3-2. AMSR/AMSR-E/AMSR2/AMSR3
Detail information for AMSR series is available from the following website.
G-Portal (Globe Portal System)
G-Portal (Globe Portal System)
3-3-3. Major variables
| Physical Quantity | Product No | Element | Array | Scale | Unit |
|---|---|---|---|---|---|
| Level 1B Brightness temperature | L1B | XXX_Brightness_ Temperature (each channel) |
nscan*196 or nscan*392 |
0.01 | K |
| Level 2 Precipitation | L2AP0 | Geophysical Quantity Data | nscan*196 | 0.1 | mm/h |
| Level 2 Total Precipitable Water | L2WV0 | Geophysical Quantity Data | nscan*196 | 0.01 | kg/m2 |
| Physical Quantity | Product No | Element | Array | Scale | Unit |
|---|---|---|---|---|---|
| Level 1B Brightness temperature | L1B | Brightness Temperature XXX (each channel) |
nscan*243 or nscan*486 |
0.01 | K |
| Level 2 Precipitation | SGPRC | Geophysical Data | nscan*243 | 0.1 | mm/h |
| Level 2 Total Precipitable Water | SGTPW | Geophysical Data | nscan*243 | 0.01 | kg/m2 |
| Level 2 All-weather Sea Surface Wind Speed | ASW | Geophysical Data | nscan*243 | 0.01 | m/s |
Note that the variables in the AMSR2 standard product is explained to be 3 dimensional dataset as "1 * scan number * 243", whereas the AMSR2 product of Tropical Cyclones database is 2 dimensional dataset as shown above.
| Physical Quantity | Product No | Element | Array | Scale | Unit |
|---|---|---|---|---|---|
| Level 1B Brightness temperature | S1BTBB | Tb_ChXX(H/V) XX is channel (H/V) is H/V pol. |
nscan*486 | 0.01 | K |
| Level 2 Precipitation | S2HPRC | DataX_P89(A/B) X is data number A/B is A/B horn |
nscan*486 | 1.0 | mm/h |
| Level 2 Total Precipitable Water | S2MTPW | DataX_P89o X is data number |
nscan*243 | 1.0 | kg/m2 |
| Level 2 All-weather Sea Surface Wind Speed | S2MASW | DataX_P89o X is data number |
nscan*243 | 1.0 | m/s |
3-4. EarthCARE
3-4-1. File specification
File names include product name, observation time, frame ID, product version, cyclone number and typhoon name.
| 2ACPR_ECO | . | 20250802 | . | 06694D | . | vBa | . | 12W | . | KROSA | . | h5 |
| product name | observation time | frame ID | product version |
cyclone number |
typhoon name | extension |
- Product version
- Frame ID
The product version is consistent with the version of EarthCARE standard product.
EarthCARE products contains a frame data. One frame is defined as 1/8 orbit. The eight frames in one orbit are identified by "frame ID" such "A", "B", "C", "D", "E", "F", "G" and "H" in order.The frame ID is same as that of EarthCARE files. (Frame definition)
HDF files are distributed via this website. The current HDF version is 5.
3-4-2. EarthCARE product
Detail information for EarthCARE product is as follows.
https://www.eorc.jaxa.jp/EARTHCARE/data/L2prd_list_std_e.html
https://www.eorc.jaxa.jp/EARTHCARE/data/L2prd_list_std_e.html
3-4-3. Major variables
| Physical Quantity | Product No | Element | Array | Unit |
|---|---|---|---|---|
| Radar Reflectivity | 2ACPR_ECO | radar_reflectivity | nray*nbin | dBZ |
| Doppler Velocity | 2ACPR_ECO | doppler_velocity | nray*nbin | m/s |
| Cloud Mask | 2ACPR_CLP | cloud_mask_cpr | nray*nbin | - |
| Radar Reflectivity (Cloud Mask applied) |
2ACPR_CLP | cloud_radar_reflectivity | nray*nbin | dBZ |
| Doppler Velocity (Cloud Mask applied) |
2ACPR_CLP | cloud_doppler_velocity | nray*nbin | m/s |
| Cloud Backscat. Coeff. | 2AATL_CLA | cloud_backscatter | nray*nbin | /m/sr |
| Cloud Top Height | 2AMSI_CLP | cloud_top_height | nscan*384 | m |
4. Others
- Classification regulation
- Data source of the tropical cyclones information
- Time information
- Images of cyclone tracks
- Images of Himawari RGB/IR
- Tools for visualization
Although the classification and naming regulation should follow the official one by WMO regional center, cyclones in this website are based on the Joint Typhoon Warning Center (JTWC), NOAA National Hurricane Center (NHC), and Central Paciffic Hurricane Center (CPHC).
As mentioned in the section 2-1, tracks of tropical cyclones are referred to the followings
until February 2011: University of Hawaii "Tropical Storms, Worldwide"
until August 2018: Unisys "Weather Hurricane/Tropical Data"
currently: University of Wisconsin "CIMSS Tropical Cyclones Page"
until February 2011: University of Hawaii "Tropical Storms, Worldwide"
until August 2018: Unisys "Weather Hurricane/Tropical Data"
currently: University of Wisconsin "CIMSS Tropical Cyclones Page"
All information with respect to time is in UTC.
Images are plotted on a Cylindrical Equidistant map projection by using "Generic Mapping Tools (GMT)" (Wessel and Smith, 1995).
Himawari RGB/IR images by using geostationary meteorological satellite (Himawari, Meteosat Third Generation (MTG)) are corresponded to the domain of the extracted satellite data.
West of 70 degrees east longitude, which is outside the observation area of Himawari, MTG images are used, and combined with Himawari images. In the composite images, differences in position and brightness may appear at the boundary areas. The brightness discrepancy is especially prominent in RGB composite images.
The lines plotted in the image indicate the sensor's swath width or the sensor's observation position.
The lines of image are referred to the followings:
| GPM: | GMI Swath Width (Black Line) DPR Swath Width (Purple Line) |
| EarthCARE: | MSI Swath Width (Black Line) CPR Observation Position (Purple Line) |
| AMSR2: | Swath Width (Red Line) |
| AMSR3: | Swath Width (Red Line) |
Please visit the webpage for TRMM/GPM and for AMSR series.
5. Release notes
- "Terms of Use of Research Data" (https://earth.jaxa.jp/policy/en.html) is applicable to this product. Please contact the JAXA/EORC Tropical Cyclone Database secretariat in advance if you would like to distribute images or data from the site to the public, such as in a pamphlet or internet.
- Users are required to indicate the data sources; an example of acknowledgments and credit lines is follows :
- We would appreciate receiving a preprint and/or reprint of publications in which you utilize our data. Relevant publications should be sent to :
- Please contact us at JAXA/EORC Tropical Cyclone Database secretariat if you have any questions or comments on the website and product.
"The data have been provided by JAXA/EORC Tropical Cyclone Database."
Tropical Cyclone Database secretariat, Earth Observation Research Center, Japan Aerospace Exploration Agency
2-1-1, Sengen, Tsukuba-city, Ibaraki 305-8505 Japan
2-1-1, Sengen, Tsukuba-city, Ibaraki 305-8505 Japan
FAX: +81-29-868-2961
E-mail:
E-mail: