1. About archived images
The archived ocean wind is retrieved by new SSW algorithm,
which is not applied to standard products. By using 6GHz and 10GHz data,
the new SSW algorithm can retrieve wind speed in good level even
under strong wind, heavy rain conditions, such as within typhoon areas.
The ocean wind images will be archived within about 4 hour
from the observation time.
The ocean wind will be retrieved as soon as
data arrive from EOC (Earth Observation Center),
i.e., processes will be made in near-real time.
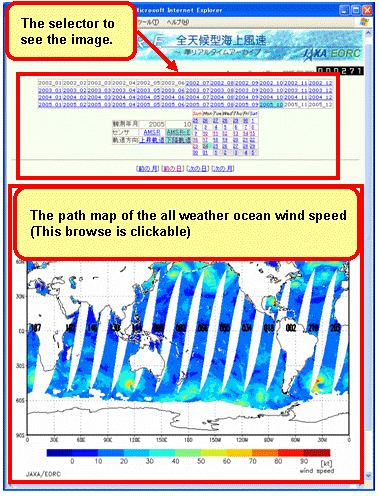
Fig.1 Top page
Fig.2 Path map of the ocean wind(clickable map)
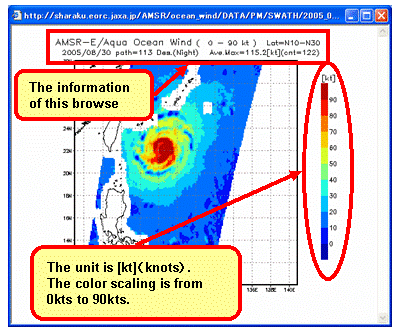
Fig.3 Enlarged images of the ocean wind
The Fig.4 shows the image of sun glitter region,
where there are no data of the ocean wind.
The sun glitter patterns appear in the descending data
of AMSR and in the ascending data of AMSR-E.
Fig.4 Sungitter regions
Fig.5 RFI regions
1.1 What is the "All Weather Ocean Wind Speed ?"
Usually, the higher frequency can not be used in rain areas.
The 6GHz and 10GHz of AMSR/AMSR-E are not so effected by rain,
which enable us to retrieve SSW in good level inside typhoon areas.
We call the ocean wind of this page as "All Weather Ocean Wind Speed."
1.2 The frequency of the updating
2. Usage of this page
2.1 Top Page
The top page of "All Weather Ocean Wind Speed" is shown in Fig.1.
The upper part is a selector of the images,
for example, sensor, observation date,
orbit direction and so forth. The lower part is the image
of the ocean wind whose condition is the result of upper part.
This image is a clickable map, which we can see
enlarge images of the target regions by clicking a designed area.
The latest image and its conditions will be shown inside this page,
when you will open the page at the first time by your browser.
2.2 Path map of the ocean wind(clickable map)
The image of the ocean wind
is shown in Fig.2. The enlarged image of the region
you click will be shown in new window.
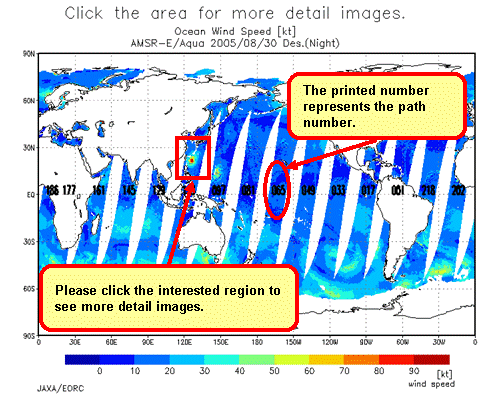
The path map images are made of 25Km grid data.
The numbers printed in the image represent path number.
The images of the ocean wind are made as a clickable map.
The enlarged images of the region you click
will be shown in new window.
2.3 Detail images of the ocean wind
The Fig.3 shows the enlarged image of the ocean wind
from the selected region in the path map.
The enlarged images are made of 10Km grid data.
At the top of the image, some useful information is shown,
such as the statistic data of the ocean wind,
as well as the observation date time, sensor/platform, and so forth.
The "Ave.Max" represents averaged value of the largest one in the region.
The "point" means the number of points for calculating the "Ave.Max."
The typical typhoon area is thought to be about 100Km X 100Km
(nearly equal to "point=100."). Therefore,
the "Ave.Max" represents the averaged wind speed
of the typhoon area.
The enlarged images, which are obtained by clicking the path map,
are made of 10Km grid data. At the top of the image, some useful information
is shown, such as the statistic data of the ocean wind, as well as
the observation date time, sensor/platform, and so forth.
2.4 Sungitter regions and RFI regions
The Fig.5 shows the image of RFI region,
where the ocean wind can not be retrieved accurately.
The recent analysis indicates that the RFI source is
the reflected beam at the ocean, of which origin
is from the LEO (Low Earth Orbit) satellites.
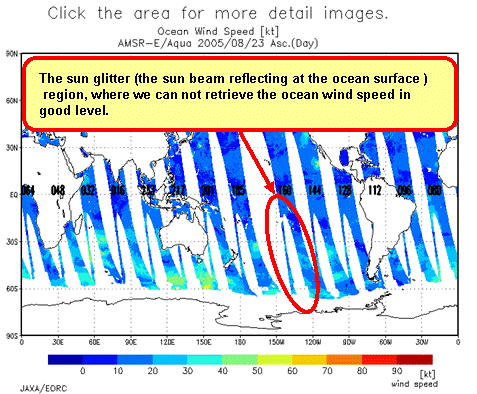
The sun glitter patterns appear in the descending data
of AMSR and in the ascending data of AMSR-E.
The ocean wind can not be retrieved accurately
inside sun glitter region. Therefore no data are
shown inside the sun glitter.
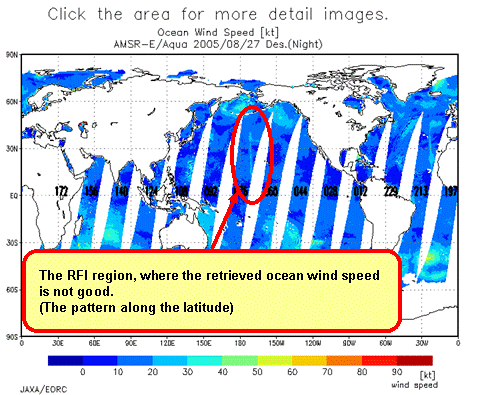
The patterns of the RFI appear in both AMSR and AMSR-E data.
The recent analysis indicates that the RFI source is the reflected beam
at the ocean, of which origin is from the LEO (Low Earth Orbit) satellites.
Inside the RFI region, ocean wind can not be retrieved accurately.
Go to TOP of this page.
JAXA/EORC
ALL RIGHTS RESERVED.