 |
| 1.Introduction |
| JAXA/EORC has been monitoring the El Nino,
using SST:Sea Surface Temperature which estimated by observation of
spaceborne passive microwave radiometers such as AMSR-E and AMSR2.
The passive microwave radiometer observes weak microwaves radiated naturally from the earth's surface and atmosphere with multiple frequency bands and
measures geophysical variables related to the global water cycle.
The microwave sensor can continuously monitor SST regardless of day and night, even independently of cloud existence. Please refer to "Terms of Use of Research Data" for the use of images. |
| [Jul/23/2014] AMSR2-based El-nino watch page updated. After the AMSR-E observations were stopped, Windsat data had been used as alternative data. However,Windsat data were replaced by AMSR2 data since July 2012. |
| [Sep/6/2011] Since December 2004, we have continued to operate El Nino Watch. Then, because the Japan Meteorological Agency expanded the El Nino news flash, new page was released as version2 in September 6 2011. El Nino watch page till then keeps updating as version 1. |
| 2.Difference in version1 and version2 |
| The difference between version 1 and 2 is summarized in the following tables. |
| Version1 | Version2 | |
| Monitoring regions | (1) El Nino monitoring region-3(NINO.3) [4S - 4N, 150W - 90W] |
(1) El Nino monitoring region-3 (NINO.3) [5S - 5N, 150W - 90W] (2) West Pacific Ocean tropical region (NINO.WEST) [0 - 15N, 130E - 150E] (3) Indian ocean tropical region(IOBW) [20S - 20N, 40E - 100E] |
| Using data | 2002/06/19 - 2011/10/04 : AMSR-E 2011/10/05 - 2012/07/23 : WindSat 2012/07/24 - present : AMSR-2 |
Same as on the left |
| Method of calculating SST |
5-day average | 5-day average of Descending path (Because Ascending path of SST has the slight positive bias due to solar radiation.) |
| Climatology | 30-year average 1971 to 2000 [Static climatology] (provided by JMA) |
30-year average of recent[Dynamic climatology] (It is calculated based on the monthly average of SST published by JMA) |
| 3.How to use this page(For Version1) | ||
| [SST:Sea Surface Temperature ] | ||
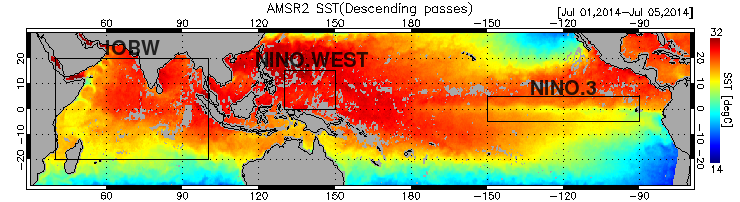 | ||
| SST image represents the 5-day average SST that obtained from AMSR-E . The areas shown in red are high temperature, and the areas shown in blue are low temperature. The gray areas are the land or areas which couldn't be estimated SST because of rainfall. It averaged in the period on the right of the picture, for example this image was made using the data averaged between December 21 2009 and December 25 2009. Rectangular lines on the image shows the monitoring region. Then, the following time series graph is the result of monitoring the SST in this region. | ||
| [SST Anomary] | ||
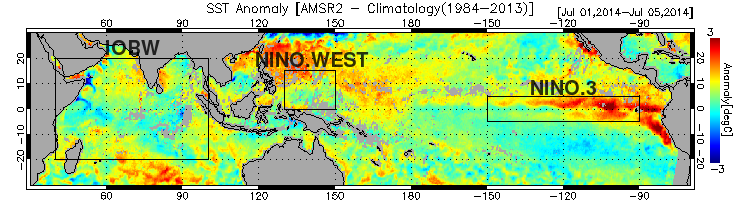 | ||
SST anomalies are calculated as follows. | ||
| [SST anomaly = AMSR-E SST - Climatology (Normal SST)] | ||
| The areas colored red are higher than normal SST,
and the areas colored blue are lower than normal SST, in the range from -3℃ to +3℃.
In this example, you can see that is higher than normal SST in the equatorial eastern Pacific Ocean. | ||
| [Time series of SST anomaly] | ||
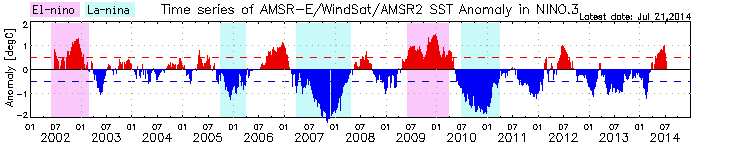 | ||
This graph shows time series of SST anomaly in monitoring region that calculated from SST anomary image. The period colored red are higher than normal SST, and the period colored blue are lower than normal SST. If the 5-month moving average of the difference between the observed SST and normal SST in Monitor area NINO3 has been higher than 0.5 ℃ for six month or more, it is called El Nino. And if it has been lower than -0.5 ℃, it is called La Nina. [Japan Meteorological Agency definitions] This El Nino Watch page has been updated data on a daily basis, it is monitoring the El Nino / La Nina in the immediate. | ||
| [Time series of SST] | ||
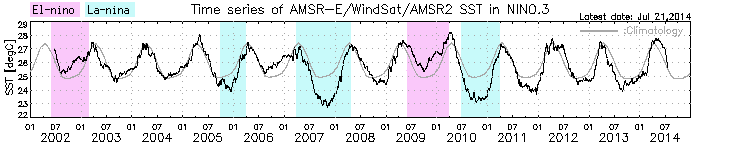 | ||
This graph shows time series of SST average in monitoring region that calculated from SST image. | ||
Japan Aerospace Exploration Agency Earth Observation Research Center
JAXA EORC ALL RIGHTS RESERVED. | ||