1.1 What is the "Ocean Wind Speed ?"
2 Usage of this page
2.1 Top page
2.2 Path map of the ocean wind direction ( clickable map )
2.3 Detail images of the ocean wind direction
3 Acknowledgment
1. About archived images
1.1 What is the "Ocean Wind Speed ?"
The archived ocean wind is retrieved by SSW algorithm, which is not applied to standard products of AMSR/AMSR-E.
By using 6GHz and 10GHz data, the new SSW algorithm can retrieve wind speed in good level even under strong wind,
heavy rain conditions, such as within typhoon areas.
The wind speed of this parameter is retrieved from the frequency 37GHz data of vertical and horizontal polarizations.
The anisotropic feature of 37GHz is corrected by the frequency 10GHz.
The wind direction is retrieved from the frequency 19GHz of third and forth polarization, combined with the information obtained in the anisotropic correction.
This parameter is available only in no-rainy areas, and wind direction is available for wind speeds larger than 6-8m/s.
The top page of "Ocean Wind Direction" is shown in Fig.1.
The upper rectangle shows a selector of the images. Users can select sensor types, observation date, and orbit direction of images they want.
The lower rectangle shows a global image of the "Ocean Wind Speed" based on selected conditions.
Please note that the global image does not show "Ocean Wind Direction".
The global image is a clickable map, which we can see enlarge images of the target regions by clicking.
And, the latest image and its conditions will be displayed when users will open this page for the first time by your browser.
Fig.1 Top page
The path map of the "Ocean Wind Direction" is shown in Fig.2.
The global image of "Ocean Wind Direction" at the top of this page is a clickable map.
Please note that the global image does not show Ocean Wind "Direction".
Fig.2 Path map of the ocean wind (clickable map)
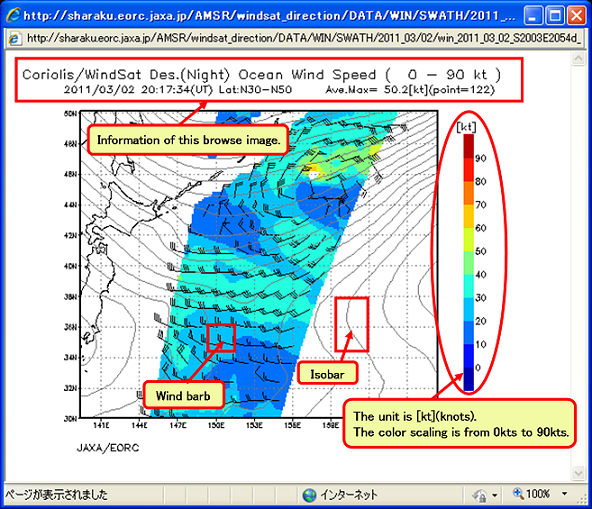
The Fig.3 shows the enlarged image of the ocean wind direction from selected region on the path map.
The enlarged images are made of 10Km grid data.
The wind barb on the image shows wind direction and speed.
The value of atmosphere pressure used for drawing isobar is based on objective analysis data released by Japan Meteorological Agency.
Ocean wind direction information in selected region is shown at the top of the image in addition to date time and orbital information ( by type of day and night observation ).
Fig.3 Enlarged images of the ocean wind direction
The WindSat instrument is a spaceborne polarimetric microwave radiometer launched by the Naval Research Laboratory (NRL)
under the sponsorship of the U.S. Navy and NPOESS in 2003. The Sensor Data Record (SDR) brightness temperatures are used for the All Weather Ocean Wind Speed processing.
SDR dataset are being made available by NRL and NOAA's National Environmental Satellite,
Data, and Information Service (NESDIS).
Usually, the higher frequency can not be used in rain areas.
The 6GHz and 10GHz of Windsat are not so affected by rain, which enable us to retrieve SSW in good level inside typhoon areas.
We call the ocean wind of this page as "All Weather Ocean Wind Speed."
1.2 What is the "WindSat (Direction)" ?
2. Usage of this page
2.1 Top Page

2.2 Path map of the ocean wind direction (clickable map)
Users can click everywhere on the path map that have been already observed.
The enlarged image of the region that you click will be shown in new window.

The path map images are made of 25Km grid data.
The numbers printed in the image represent path number.
The images of the ocean wind are made as a clickable map.
The enlarged images of the region you click will be shown in new window.
2.3 Detail images of the ocean wind direction
Two statistical information, "Ave.Max" and "point" are shown as ocean wind speed information.
The "Ave.Max" represents averaged value of the largest one in the region.
The "point" means the number of points for calculating the "Ave.Max".
The typical typhoon area is thought to be about 100Km X 100Km (nearly equal to "point=100.").
Therefore, the "Ave.Max" represents the averaged wind speed of the typhoon area.
The enlarged images, which are obtained by clicking the path map, are made of 10Km grid data.
At the top of the image, some useful information is shown, such as the statistic data of the ocean wind,
as well as the observation date time, sensor/platform, and so forth.
3. Acknowledgment
Go to TOP of this page.
JAXA/EORC
ALL RIGHTS RESERVED.