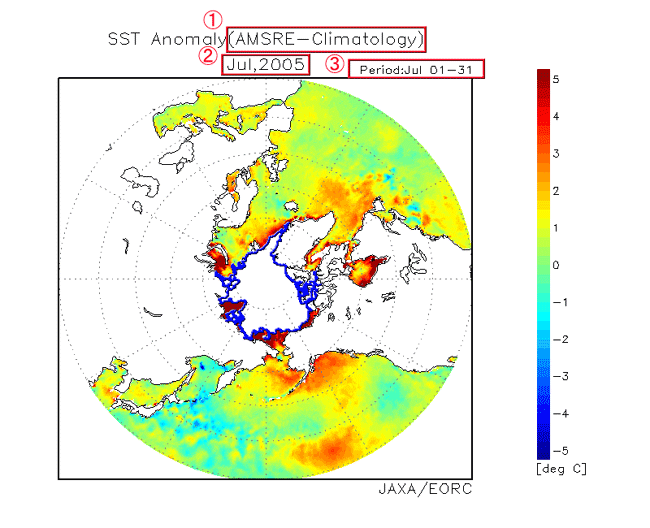
- The (1) of the image shows a calculation method of SST Anomaly.
The climate value that we used by a calculation was offered by the Meteorological Agency.(Data Span : 1971-2000).
- The (2) of the image shows the period of data.
As an example, this image is a thing of July, 2005.
- The update of data is performed once a day.
(When it is until from July 1 to July 16, and the average of a displayed image is calculated, and data of 17th were added by update, We calculate average data of from 1 to 17 newly again and make it again.)
- We show a value of -5 degrees Celsius - +5 degrees Celsius at color gradation to the red from blue with the SST Anomaly image of this page.
When SST is lower than an average year, it is blue, and it is displayed with red when it is high.
The white shows land. But the part surrounded with the middle of the upper image, blue is originally the sea, but it is displayed with white not to be able to observe it because actually it is covered in ice.
We know the following from an image displaying from this here.
- This image shows the SST Anomaly that attracted a climate value from the thing which averaged SST data from July 1, 2005 to 31st.
- Temperature is higher in the neighborhood of shoreline of the pole than an average year, and the Japanese neighborhood is degree at the same level as an average year.
|