
|
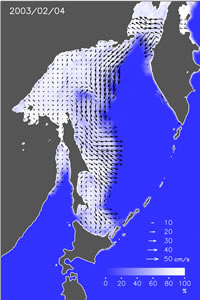
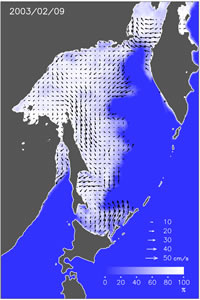
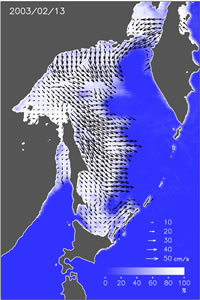
| White area shows sea ice area. We can see that over a half of the Okhotsk Sea is covered by the ice. The ice drifting speeds and directions are shown by lengths and directions of vectors. The vectors are plotted at 45 × 45 km resolution.
The Okhotsk sea ice generally moves to southward or southeastward driven by southward ocean currents and prevailing northerly winds. Observed change in the ice motion field can be explained by that in wind speed and direction. For example, strong southeastward ice motion seen in February 13 is caused by a strong northwesterly wind. Temporal changes in the ice extent and ice motion are evidently controlled by local wind condition. » See Larger Image (1000×1500pixels:197KB) |
| » See Larger Image (1000×1500pixels:213KB) |
| » See Larger Image (1000×1500pixels:272KB) 
|